8.5 Low Voltage Cables and Distribution Busbars
This is where the real detective work starts and the tools that are available with this guide will help. If the records are good and you have cable schedules to hand, then that is a real bonus. Even then, if the records are generated by “in service” testing and inspection regimes, then do not expect the information to be accurate for the purposes of arc flash calculations. They will, however, be a good guide. If the records are “as fitted”, then this is usually generated by a design engineer and whilst the cable sizes and types are likely to be accurate, the cable lengths may not be. The message is caution, sense checking and inspection.
How long is the cable? The length of the cable is quite important if it is low voltage, but accuracy of a high voltage cable is not as critical to the calculation of incident energy. Having possession of accurate site plans is really beneficial. Cable management systems can be marked up onto the plans and once the accuracy is validated, this can save a great deal of work by scaling off cable runs. Confidence is the key as the final figure is going to be used to calculate the fault level which will determine the incident energy. Where this confidence is in question, then a good idea will be to run ‘what if’ scenarios where the incident energy is calculated for different lengths. For high voltage cables, an increase in length and therefore circuit will normally result in a decrease in incident energy. For low voltage cables, the opposite may be true due to the fault level paradox explained in Chapter 4: Prediction.
Cables with a plastic over sheath whether PVC or XLPE will usually have the information embossed or indented onto them for identification purposes (See below, Figure 8.18). In addition, there is sometimes a marker on the outside of the cable giving distance in metres which can be really useful. So, you just subtract distance at the receiving end from the distance at the source and you have the cable length. It might be a good idea to have some chalk handy to rub onto the sheath of the cable to make any marking easier to read. White tape or paper and a soft leaded pencil will often do the trick as well.

Figure 8.18 Cable markings
The next issue is to determine the type of cable and what material the conductors made from. For modern cables that are embossed on the sheath as shown in figure 8.18 above, that can be determined very easily. I have known times when the whole data collection experience has been made so much easier because of clear cable markings. There have been other situations because of the age of the site where this information has been more difficult to collect. I might just add here that I have come across a large site where there had been counterfeit cables installed which I suspect was more common at some time in the past. Not only no markings, but the XLPE insulation was wafer thin in places so please be mindful that if a cable looks insulated in a cable box, it might not be.
The cable diameter is a good pointer towards the size of the cable if you know what the conductor material is, and manufacturer’s data will help determine conductor size from the outside diameter of the cable. Also beware, that I have come across reduced neutral conductors as part of a four-core cable but, on enquiry to local cable manufacturers, there does not seem to be a large market nowadays. Another strategy is to examine the terminations as a last resort, dead of course. The terminal lugs will very often have the core size stamped on the lug. As always, sense check information like this against other factors just in case oversized lugs may have been used.
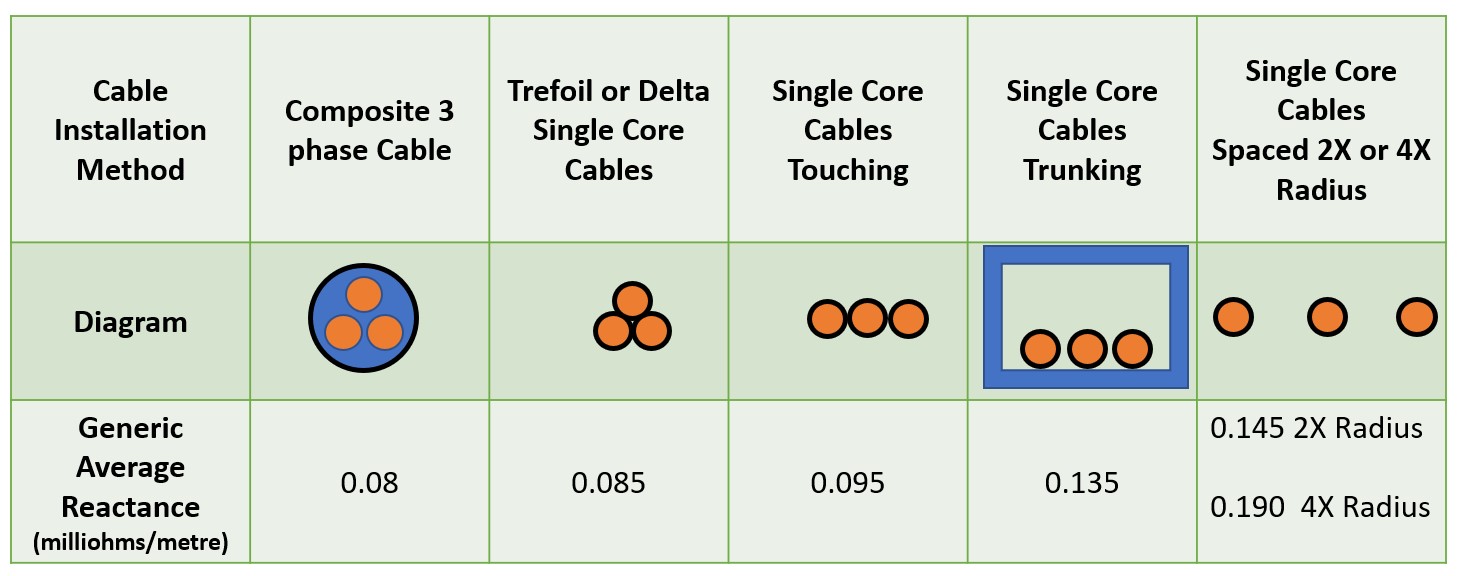
The way in which the cable is installed, also has a significant effect upon the impedance of larger cables. It should also be pointed out that the larger the cable, the more that the reactance will contribute towards total impedance. For instance, the X/R ratio tends to approach one for copper cables at about 300mm2. Above that cable size, reactance has a greater contribution to overall impedance. Single core cables in particular can have large variations in reactance dependent upon installation method. For instance, single core cables laid flat and spaced can have reactance values that are double those in trefoil formation. That is very significant for transformer tails as the X/R ratio can be as high as four times. A similar effect of increased reactance can be experienced for cables installed in trunking. As can be seen, the reactance values can vary widely with different installation methods and any electrical engineer who is carrying out retrospective system studies needs to be aware of this fact.

Figure 8.19 Average reactance values – source Schneider Electric
Data from distribution busbar systems can usually be found from manufacturer’s data sheets. Rarely can the impedance data be determined from busbar nameplates and the extent of useful information will be the current rating and voltage. Even the busbar material and cross-sectional area will be missing so applying generic data will be difficult without reference to the manufacturer’s data sheets. The good news is, that most present-day suppliers provide comprehensive data on their products and information such as resistance, reactance, current carrying capacity, short circuit withstand, and voltage drop.